CivMetrics collects key public health data for the largest cities in the United States. We’re posting some of our insights here. In this installment, we look at the the COVID vaccination rate in metro counties (aka, counties close to urban centers). For questions about our data, or to request data, please contact EBallantine@CivMetrics.com. Data is from the CDC.
A metro county is a county that contains a city of 50,000+ residents. Which metro counties are getting vaccinated, and which aren’t? At the bottom of this page, find a sortable table of all 1,200+ metro counties in the US and each county’s vaccination rate. But first, some highlights.
Here are the 10 metro counties with the lowest vaccination rates:

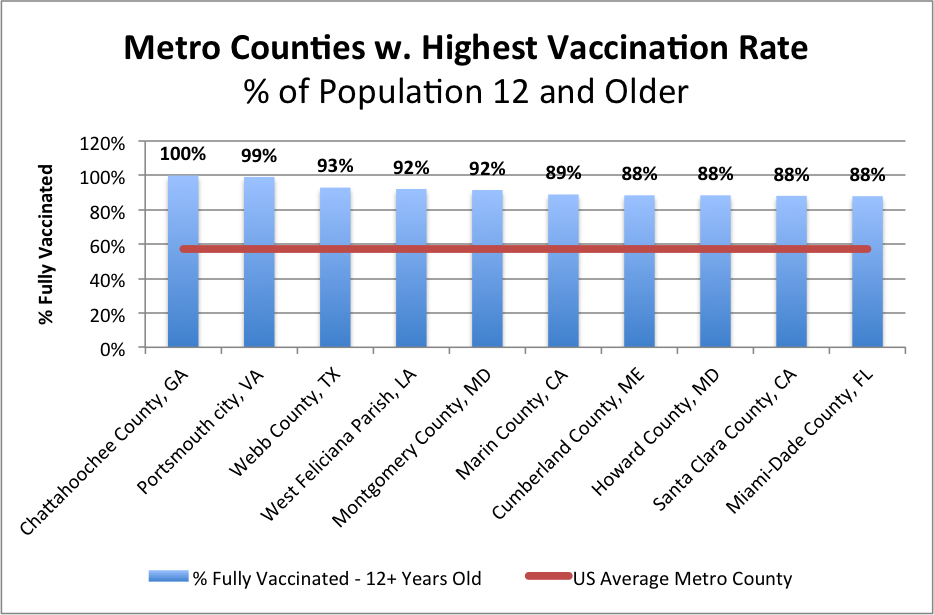
And here are the 10 metro counties with the highest rate of vaccination:
Below, find a sortable table of all 1,200+ metro counties in the US and each county’s vaccination rate.