Civic Development News and Data
The latest local trends, news and insights on infrastructure, economic development, housing and economics.


Core Inflation Climbs 3.1% in July as Tariff Costs Start to Bite
US consumer prices rose 2.7% in July compared with a year ago, with core inflation climbing 3.1% as tariffs under President Donald Trump’s trade policy began lifting the costs. While energy prices fell 1.6% year-over-year, higher prices for food, housing, medical...

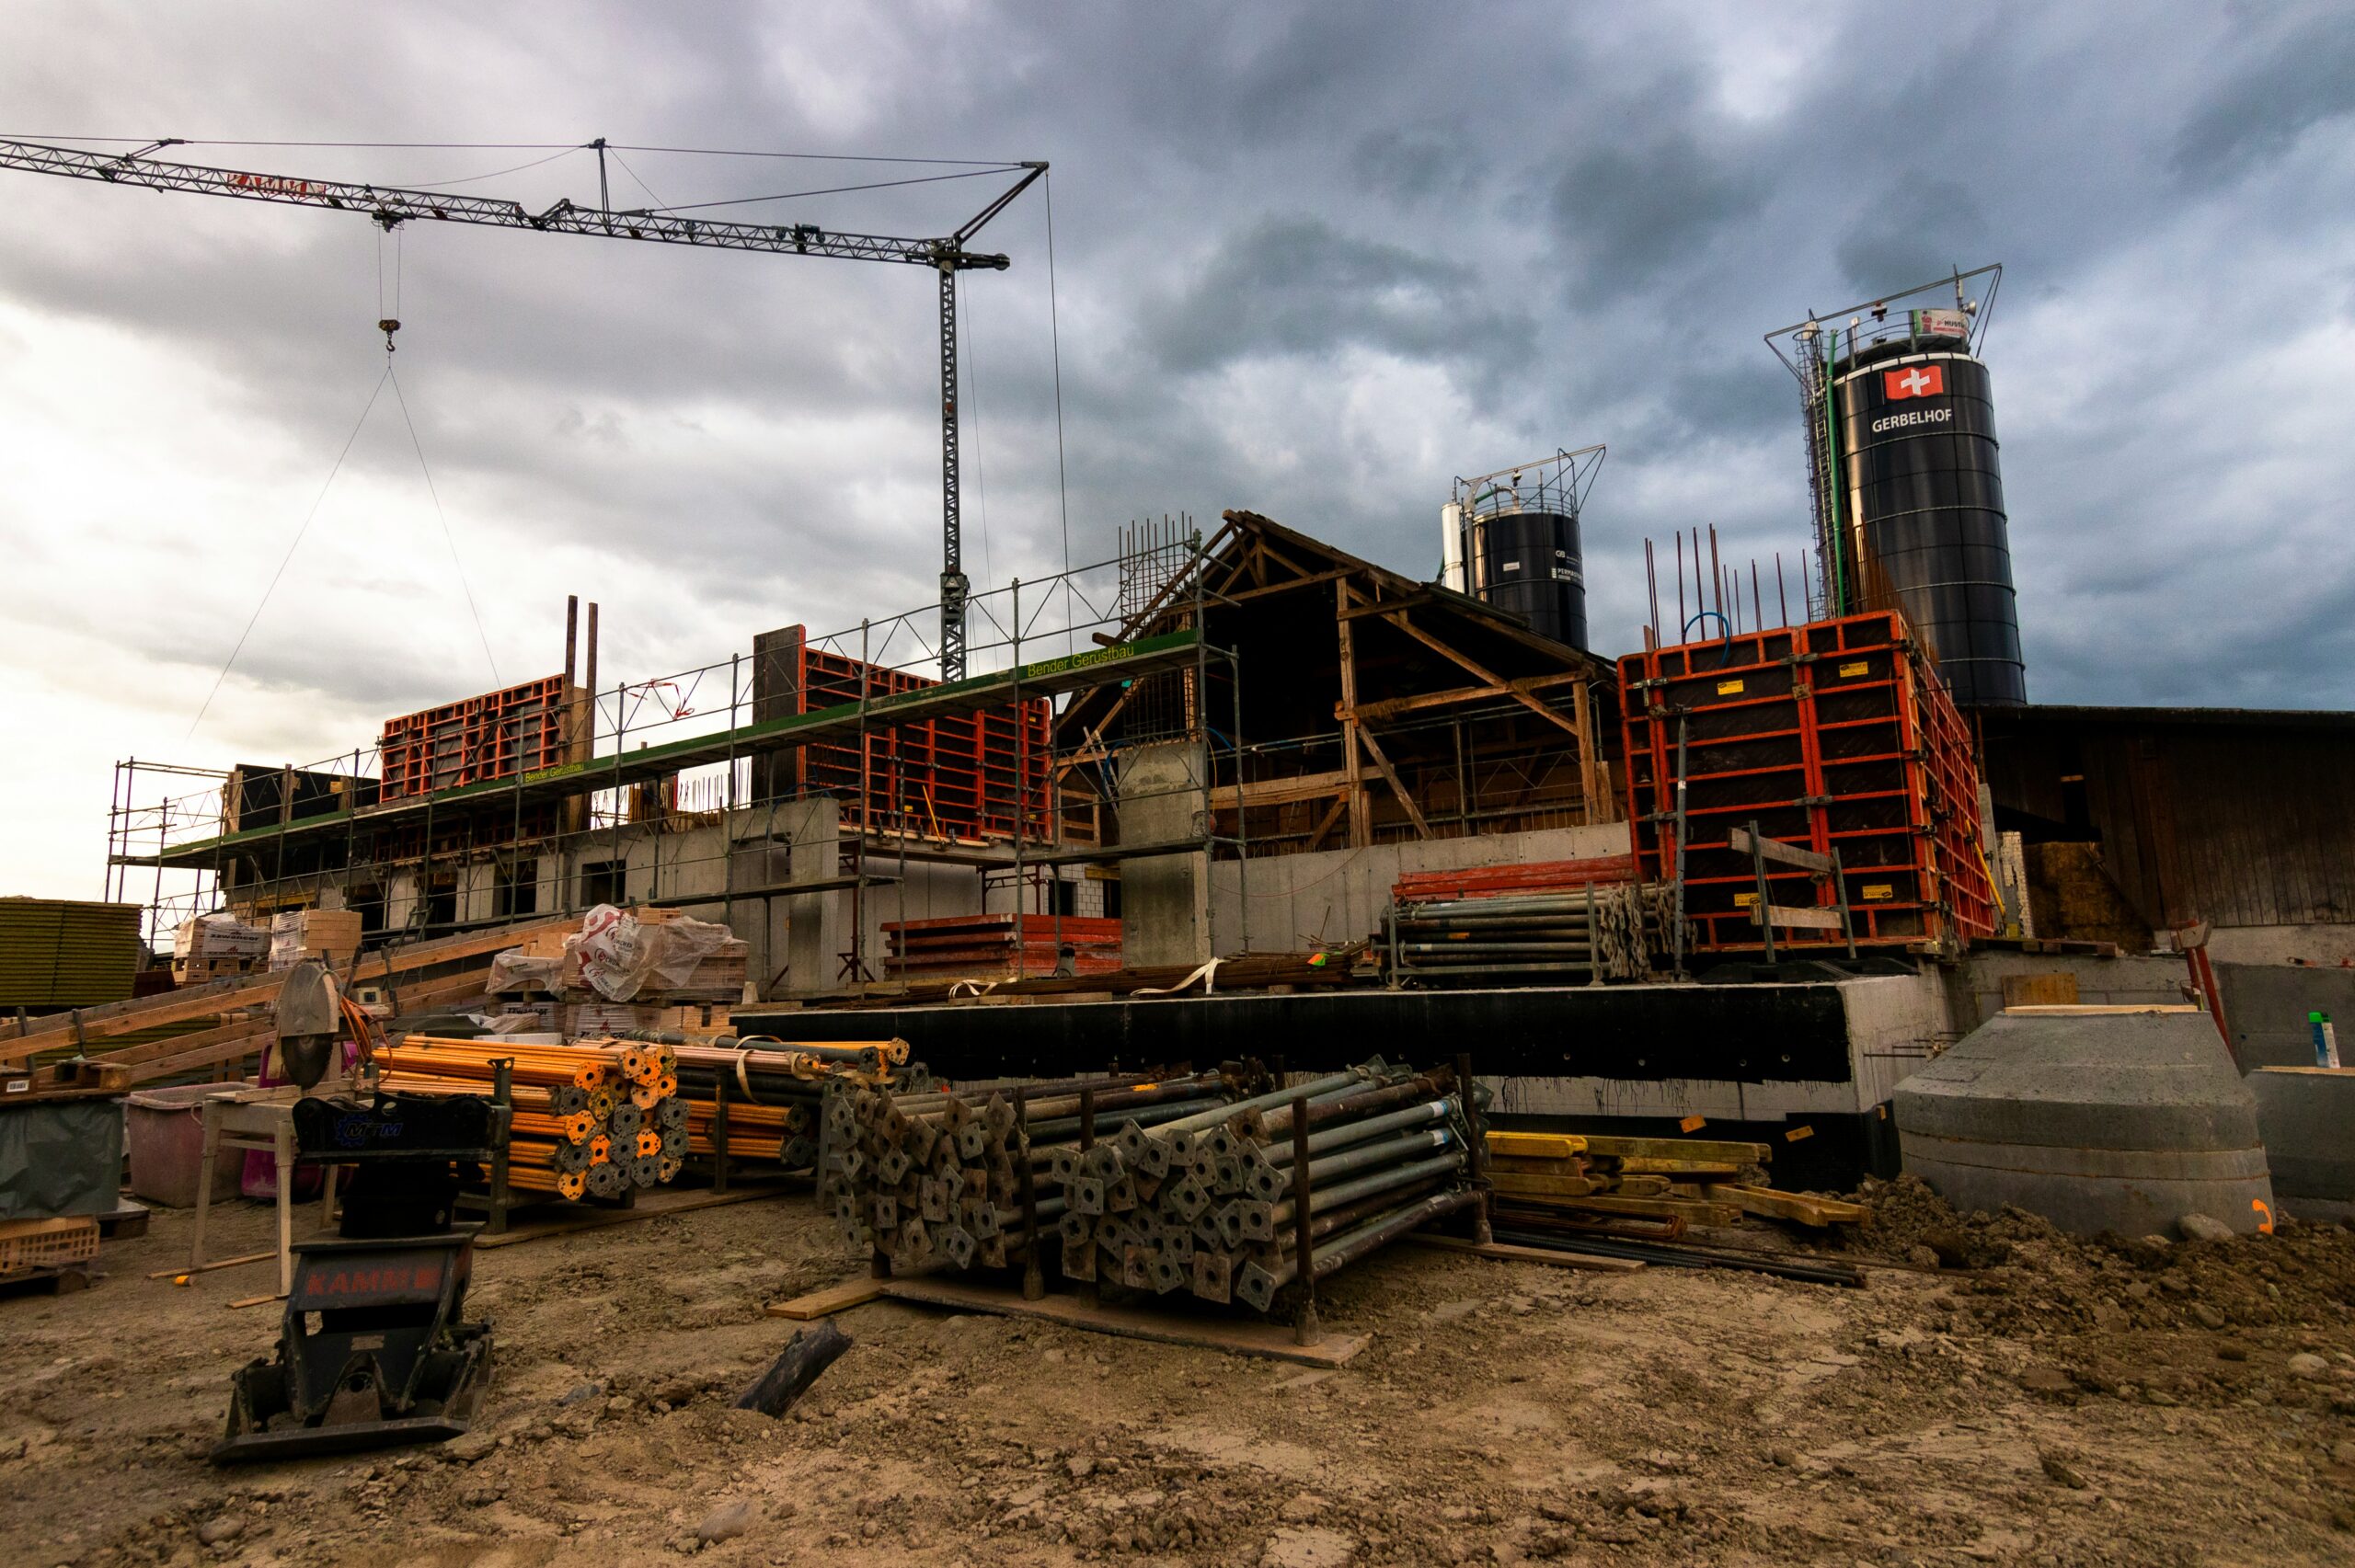
CFM Picks Heflin, Alabama for $7 Million Plant
Contour Fabrications and Mechanical will build a $7 million plant in Heflin, Alabama, creating up to 30 jobs. The facility will refurbish and maintain large steel reels for Southwire’s nearby cable manufacturing plants. Supported by $2 million from the Growing Alabama...

Rockwell Automation Commits $2 Billion to Expand U.S. Manufacturing Operations
Rockwell Automation will invest $2 billion over the next five years in its U.S. manufacturing plants, workforce, and digital infrastructure, with most spending focused in Ohio and Wisconsin. The company has resumed hiring after last year’s job cuts, though no specific...

Merck Slashing 6,000 Jobs, With 58 at New Jersey Headquarters
As part of a global restructuring, Merck plans to cut roughly 6,000 jobs to reduce expenses by $3 billion a year by 2027. A New Jersey WARN Act filing shows 58 positions will be lost at the Rahway campus, the company’s world headquarters. The cuts will hit...

Tariff Truce Between U.S. and China Stretched to Nov. 10
The U.S. has extended its pause on additional retaliatory tariffs for Chinese imports until Nov. 10, citing “significant steps” from China in ongoing trade talks. The move follows a May agreement in which both countries reduced certain duties, easing tensions in their...

Economic Outlook Brightens, Risks Still Loom for Seattle
Seattle’s latest economic forecast shows improvement, with 2025 general fund revenue now projected at $1.63 billion, which is $62.8 million higher than earlier estimates. The brighter view comes as tariffs have so far had less economic impact than expected and lower...

Welspun to Invest $150M in Arkansas Plant
Welspun Tubular LLC will invest $150 million to build a new Longitudinally Submerged Arc Welded (LSAW) line pipe mill and coating facility and coating facility at its Little Rock, Arkansas site, creating 300 jobs. The expansion will make it the only U.S. facility...

Apple Unveils $100B U.S. Manufacturing Plan
Apple is committing $100 billion to expand U.S. manufacturing, creating 20,000 jobs and launching its American Manufacturing Program to strengthen domestic supply chains. The initiative includes a $2.5 billion investment in Corning’s Kentucky facility and partnerships...

Uptown Rental Properties Completes $29M Student Housing Project Near University of Cincinnati
Uptown Rental Properties has completed a $29 million student housing project near the University of Cincinnati, offering 190 beds across 55 units in a five-story building above a two-story parking podium. The development includes amenities such as a fitness room,...

$144.5M in Funding Supports Affordable Housing Across California
The California Department of Housing and Community Development announced over $144.5 million in federal awards from the HOME Investment Partnerships Program to support affordable housing. The funding will assist 984 households across the state through rental...
Explore Our Metro Data Libraries
Explore our premium metro data libraries, including deals, contracts, financing documents, RFP libraries and our Who’s Who directories of top professionals. All for free.
Listen to Our Civic Development Podcast!
Dive into civic development with expert commentary on all areas of civic finance: infrastructure, affordable housing, economic development and more.

Newsletter
Sign up below to get weekly alerts for newly added datasets, news and more.