CivMetrics collects key real estate data for the largest cities in the United States. In this post, we look at new FHFA home price data for every metro. For questions about our data, or to request data, please contact [email protected]. Data is from the Federal Housing Finance Agency, released February 27, 2024.
The latest FHFA Home Price Index (HPI) data illuminates the house price indices in 100 US metro areas.
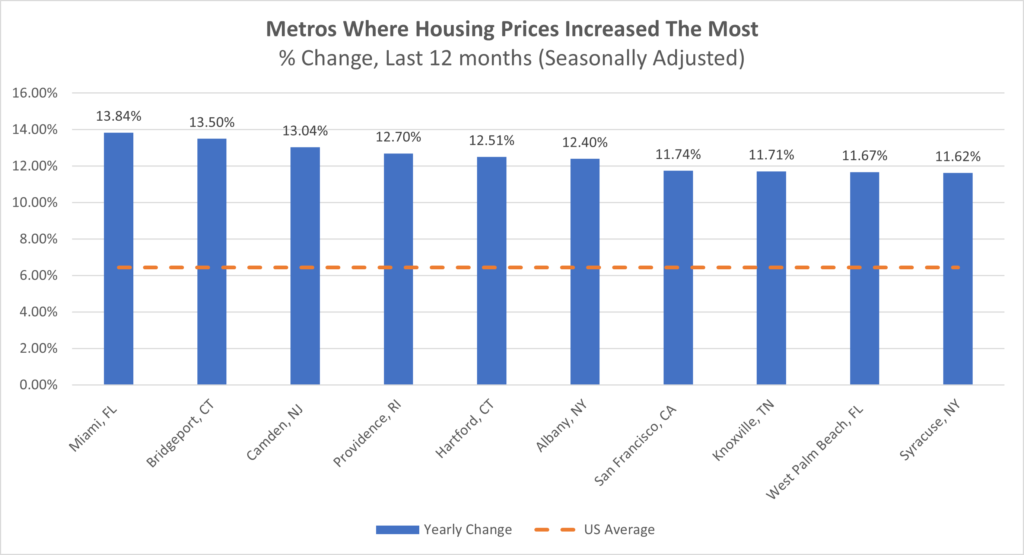
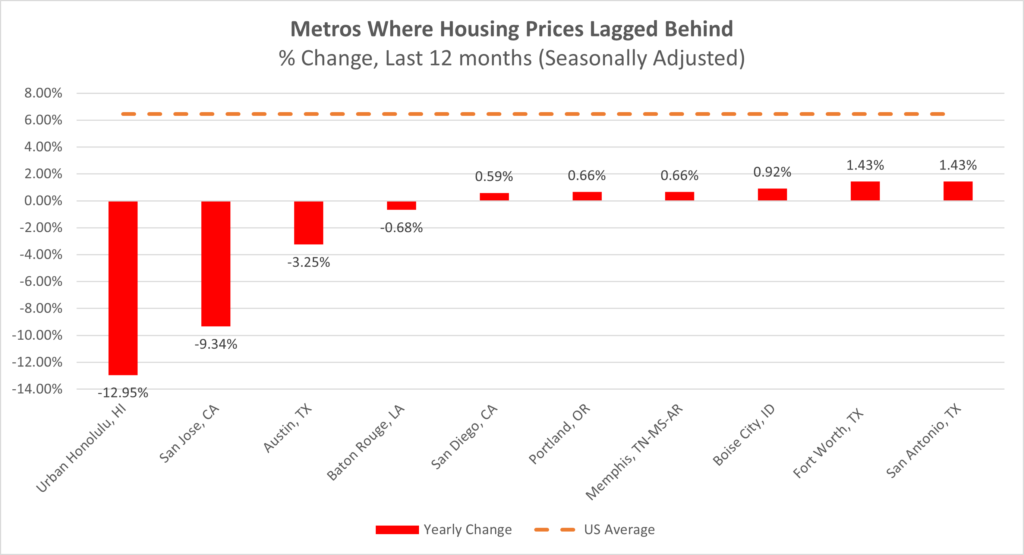
As of Q4 2023, house prices were up 1.5 percent from the last quarter and rose 6.5 percent year-over-year.
The Home Price Index is a broad measure of the price of single family homes.
Here are the ten metros with the greatest yearly growth in house prices:

The 10 metros where house prices grew the least:

Below, find a sortable list of 100 metros, their house price index data and the quarterly and yearly change.


