CivMetrics collects key demographic data for the largest MSAs in the United States. We’re posting some of our insights here. In this installment, we look at population growth by MSA. Which areas have seen their population decline the most over the last 10 years? For questions about our data, or to request data, please contact [email protected]
At the bottom of this page, you can find a sortable table of 10-year population growth in 415 metro and micro areas.
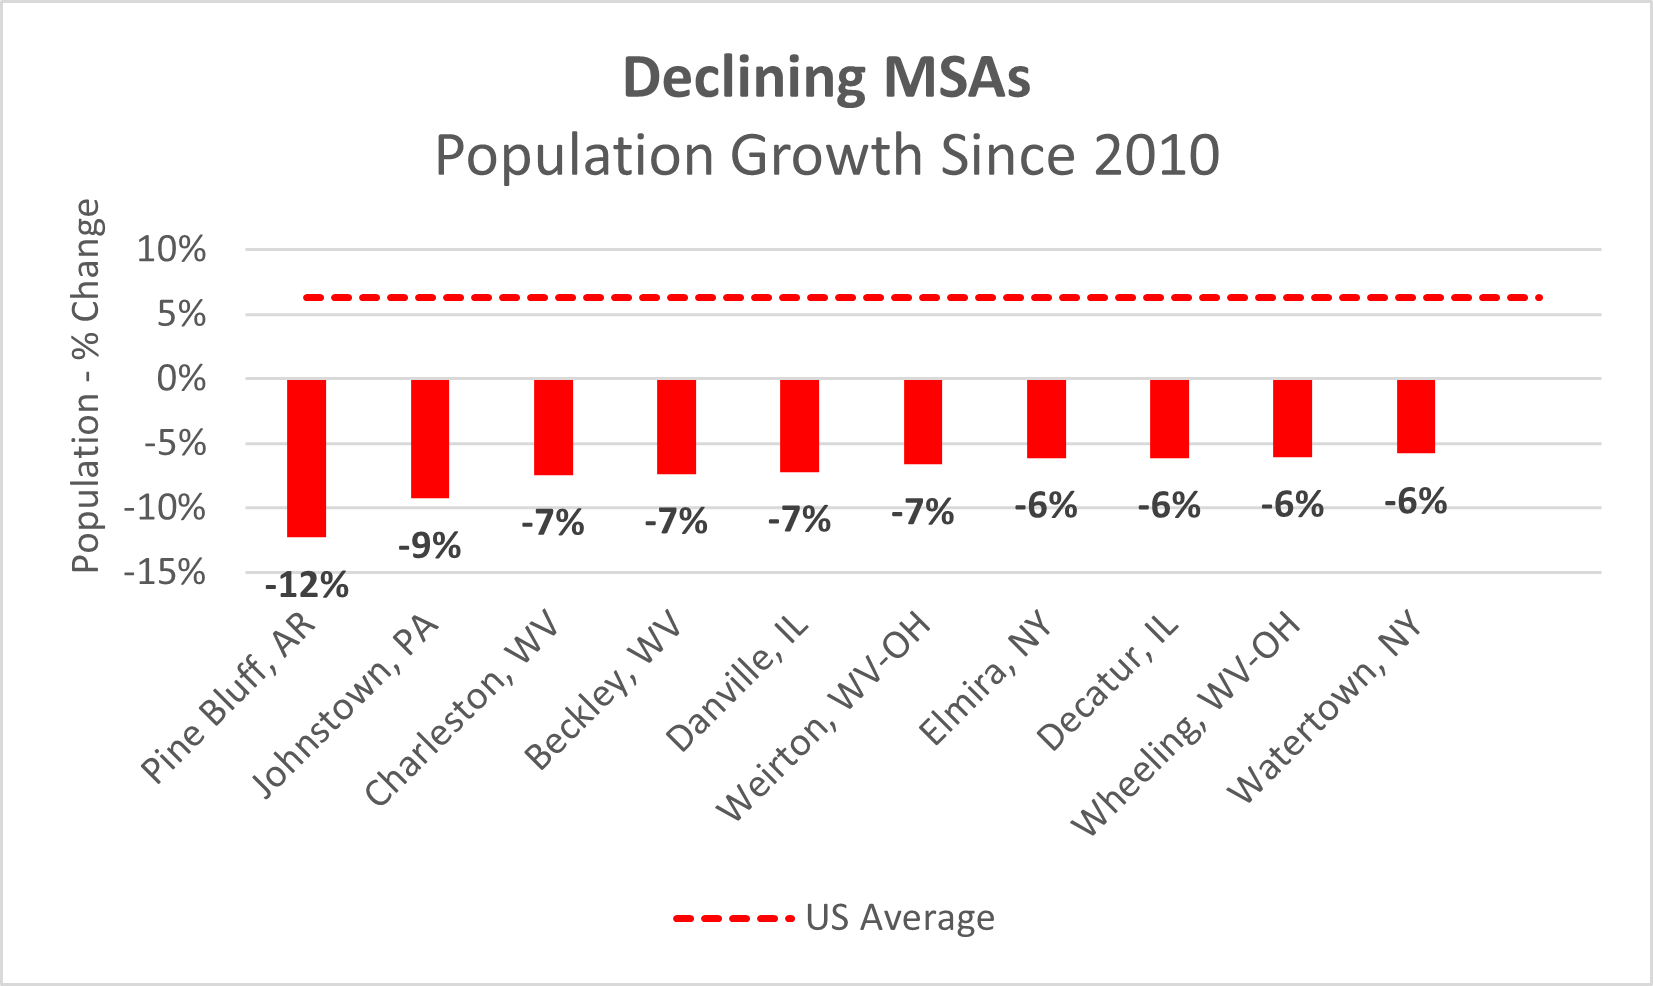
The U.S. population has grown about 6 percent since 2010. But some MSAs aren’t growing at all; they’ve seen populations decline in the last 10 years. Here are the 10 MSAs that have grown the least since 2010:
Below, you can sort our entire dataset of population growth in 415 MSAs.