CivMetrics analyzes residential and commercial real estate data for the largest cities in the United States. We’re posting some of our insights here. In this installment, we look at Apartment List data on rental prices in all U.S. MSAs. Where are rents growing the fastest? How have rents in large MSAs changed since the pandemic began?
At the bottom of this page you can find a full table of the 15-month rent increases for all MSAs in the United States. But first, a few highlights.
Overall, rents in some of the largest US cities are still down compared to pre-pandemic figures (March 2020). However, average rent across the US is up nearly 20% since the start of the pandemic. That growth is being driven by small and medium MSAs across the country, but particularly in the Southwest and Northwest regions.
Which MSAs have seen the biggest rent increases since the pandemic began (in March 2020)? The Northwest and the Southeast are two hot spots:

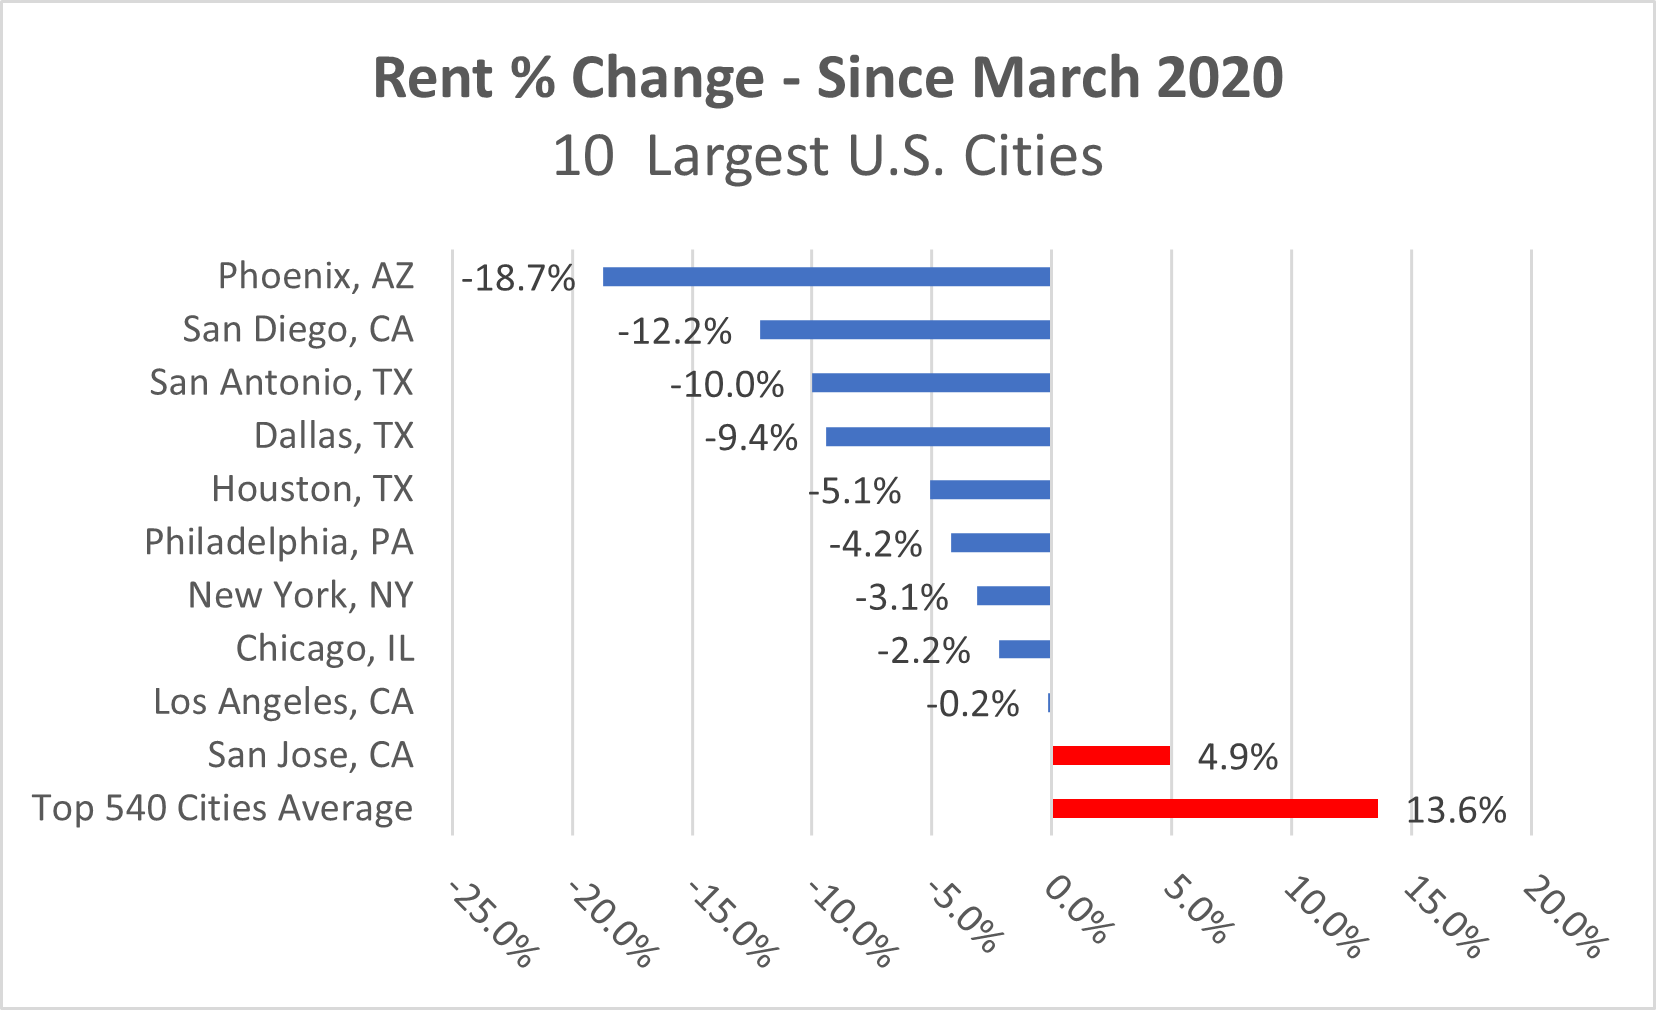
Here’s how rent looks in the 10 largest cities, in August 2021 vs March 2020.

What does that look like compared to the national average? As you can see, average rent in 9 of the 10 largest cities is down from pre-pandemic levels.
Here’s the full list of rent changes for all U.S. MSAs: