CivMetrics collects key public health data for the largest cities in the United States. We’re posting some of our insights here. In this installment, we look at the the COVID vaccination rate in major cities. For questions about our data, or to request data, please contact [email protected]. Data is collected manually from city-level sources.
Vaccination data at the city level is hard to come by. CivMetrics collected the COVID vaccination rates for 30 large U.S. cities — which cities are getting vaccinated quickly, and which are falling behind? At the bottom of this page, find a sortable table of vaccination rates for all 30 cities. But first, some highlights:
Here are the 10 cities with the highest vaccination rate:
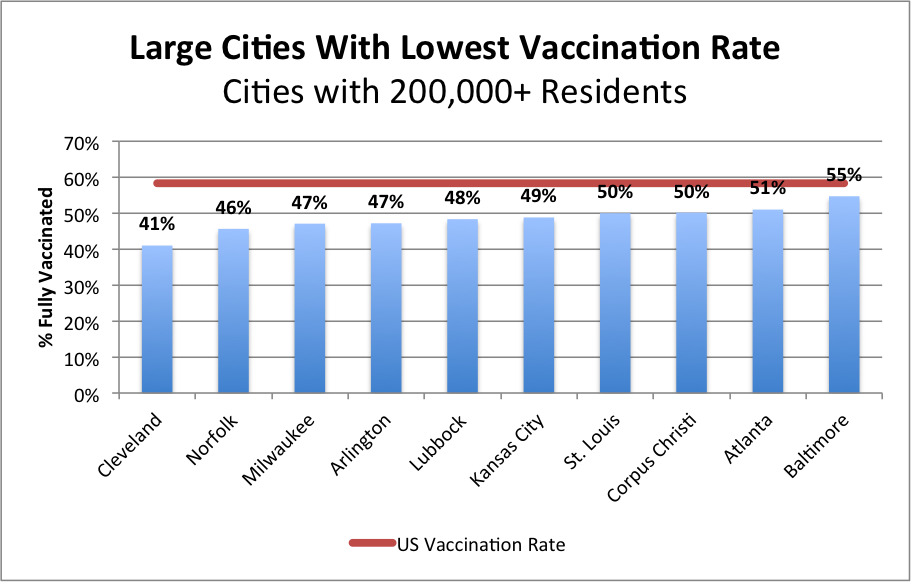
Meanwhile, here are the 10 cities with the lowest vaccination rate:
Below, find a sortable table of vaccination rates for all 30 cities:


