CivMetrics collects key public health data for the largest cities in the United States. We’re posting some of our insights here. In this installment, we look at the air quality in major cities. For questions about our data, or to request data, please contact [email protected]. Data is from the EPA.
More than 40% of Americans live in areas with unhealthy levels of air pollution, according to the American Lung Association.
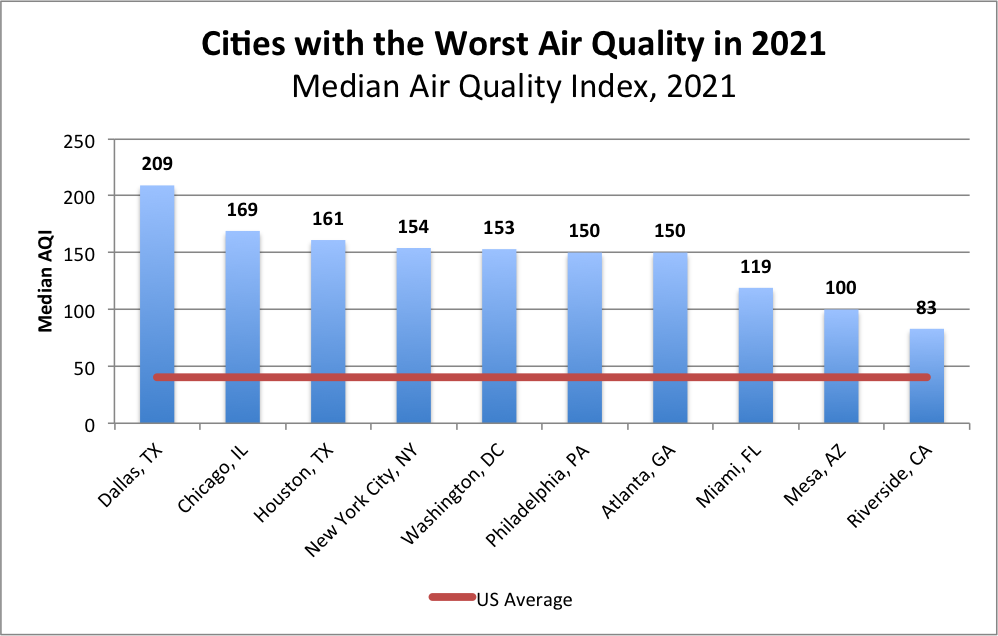
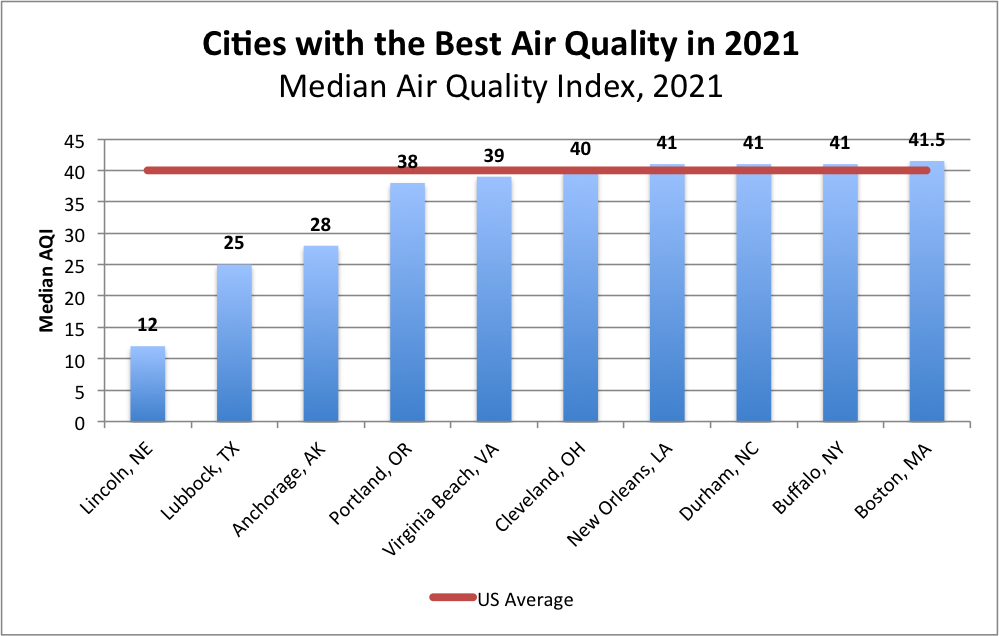
Which cities had the worst and best air quality in 2021? For this analysis, we use the EPA’s Air Quality Index (AQI).
0 – 50 = Good air quality
51 – 100 = Moderate
101 – 150 = Unhealthy for sensitive groups
151 – 200 = Unhealthy
201 – 300 = Very Unhealthy
301 – 500 = Hazardous
Here are the 10 cities with the worst air quality this year:
Here are the 10 cities with the best air quality:
Below, find a sortable chart of the 2021 median AQI for the 100 largest US cities: