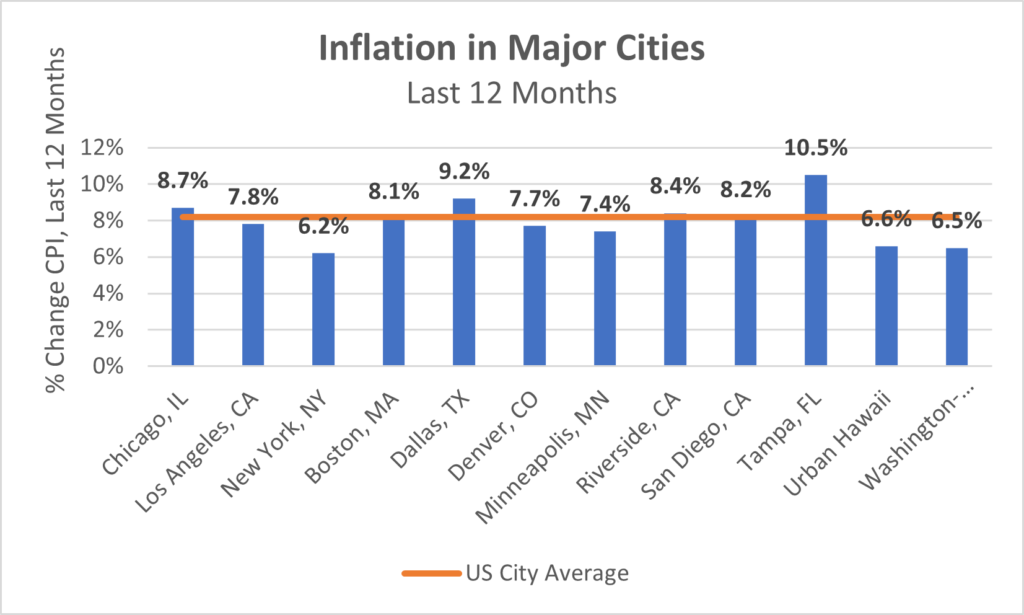
CivMetrics collects key economic data for the largest cities in the United States. In this post, we look at the latest CPI release and the 12 cities tracked in this release. For questions about our data, or to request data, please contact [email protected]. Data is from the Bureau of Labor Statistics, released October 13, 2022.
New CPI data illuminates inflation in 12 major cities, and how they compare to the national city average.
CPI rose 0.4% nationally (all urban consumers) in September; and 8.2% over the last 12 months ending September 2022, according to the new data.
The new release includes individual data for 12 cities:

Below, find a sortable chart of the 12 cities and % change over 12 months, 2 months and 1 month (“no data” means the city’s CPI was not tracked over this period).


