CivMetrics collects key demographic data for the largest MSAs in the United States. We’re posting some of our insights here. In this installment, we look at personal income by MSA. In which areas has personal income been rising over the last 10 years, and where has it been stagnant? For questions about our data, or to request data, please contact [email protected]
At the bottom of this page, find a sortable table of personal income growth over the last 10 years in 435 MSAs. But first, a couple highlights.
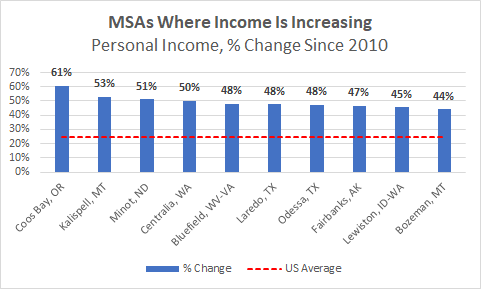
Personal income in the average MSA has grown 15% since 2010. But in some MSAs, the growth is much higher. Here are the 10 MSAs with the highest growth in median personal income since 2010:
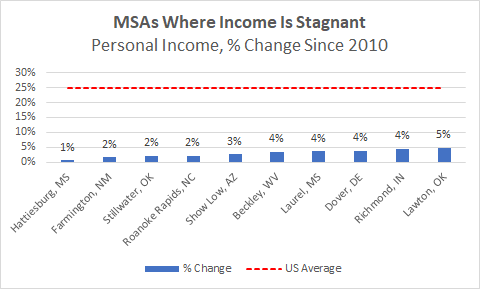
There are zero MSAs where income has decline since 2010. But there are many areas where income is stagnant. Here are the 10 areas where income has barely budged in the last 10 years:
Below, find a sortable chart of the median personal income of 435 MSAs.