CivMetrics collects key economic data for metro areas in the United States. In this flash installment, we look at the newly-released metro-level CPI data for January 2022. For questions about our data, or to request data, please contact [email protected]. Data is from the Bureau of Labor Statistics.
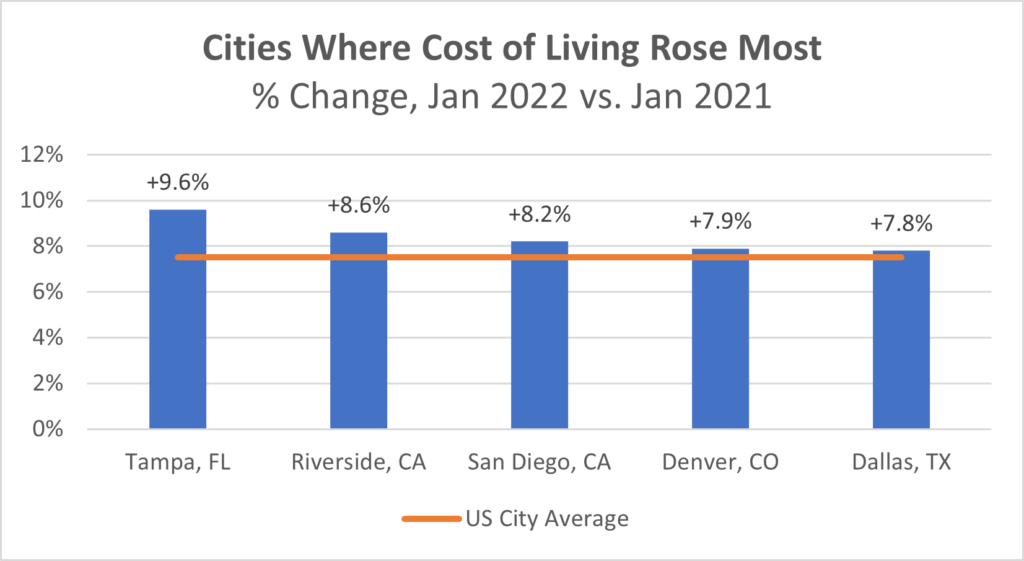
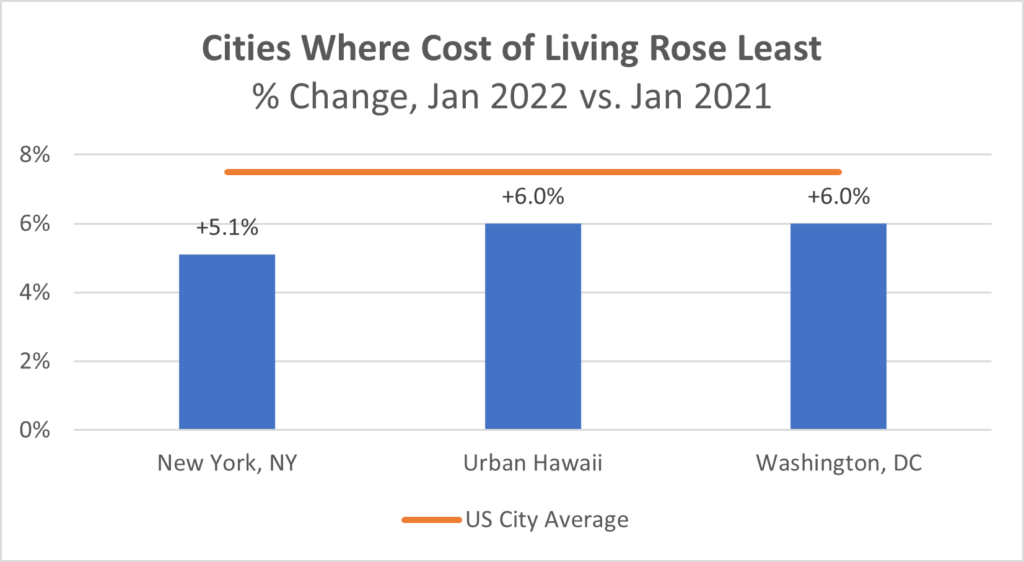
The all-item Consumer Price Index (CPI) rose 7.5% in the average US city in January 2022 (compared to January ’21), according to new data from the Bureau of Labor Statistics.
Some metros, like the Tampa and Riverside areas, saw starker increases in cost of living:

Meanwhile, New York and Washington DC experienced a smaller uptick than the average city:

What accounts for the increases? Part of the reason is the rising cost of home-related purchases which have become necessary for remote workers. Reaction from Dawn Kovner, Economist at Welch Consulting:
In the two years since the start of pandemic-induced social isolation, telecommuting, travel restrictions and Zoom school for the kids, we have been forced to become homebodies and our homes have paid the price. The U.S. Bureau of Labor Statistics just reported the largest ever (“L-EVER”) recorded increases in the cost of keeping our home interiors live-able.

The cost of window coverings (to keep the mid-day sun off our monitors and the street sounds off our Zoom call) saw the largest ever price increases in the twelve-month period ending January 2022. The cost to replace the household furniture (which saw double-duty as work stations, filing systems and classrooms) also saw their largest ever price increases. These are unprecedented price spikes caused by sudden and widespread demand for what used to be relatively stable commodities. These statistics bear witness to the silent devastation suffered by our home interiors caused by our ever-constant presence. But at least the pets have company.

- Dawn Kovner, M.P.P. Economist, Welch Consulting
Below, find a sortable table of the latest CPI data for all available metro areas. NOTE: In cities where data is reported bi-monthly, most recent month of data is used.


