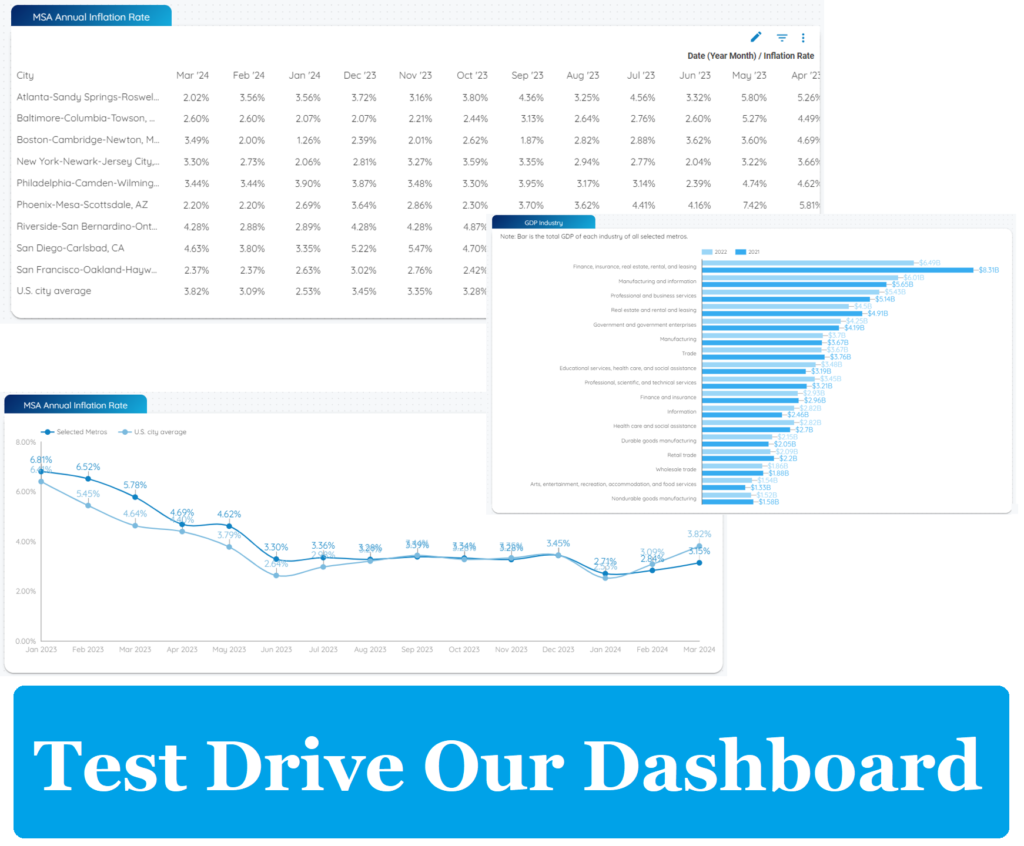
CivMetrics collects key economic data for metro areas in the United States. In this flash installment, we look at the newly-released metro-level CPI data for December 2021. For questions about our data, or to request data, please contact [email protected]. Data is from the Bureau of Labor Statistics.
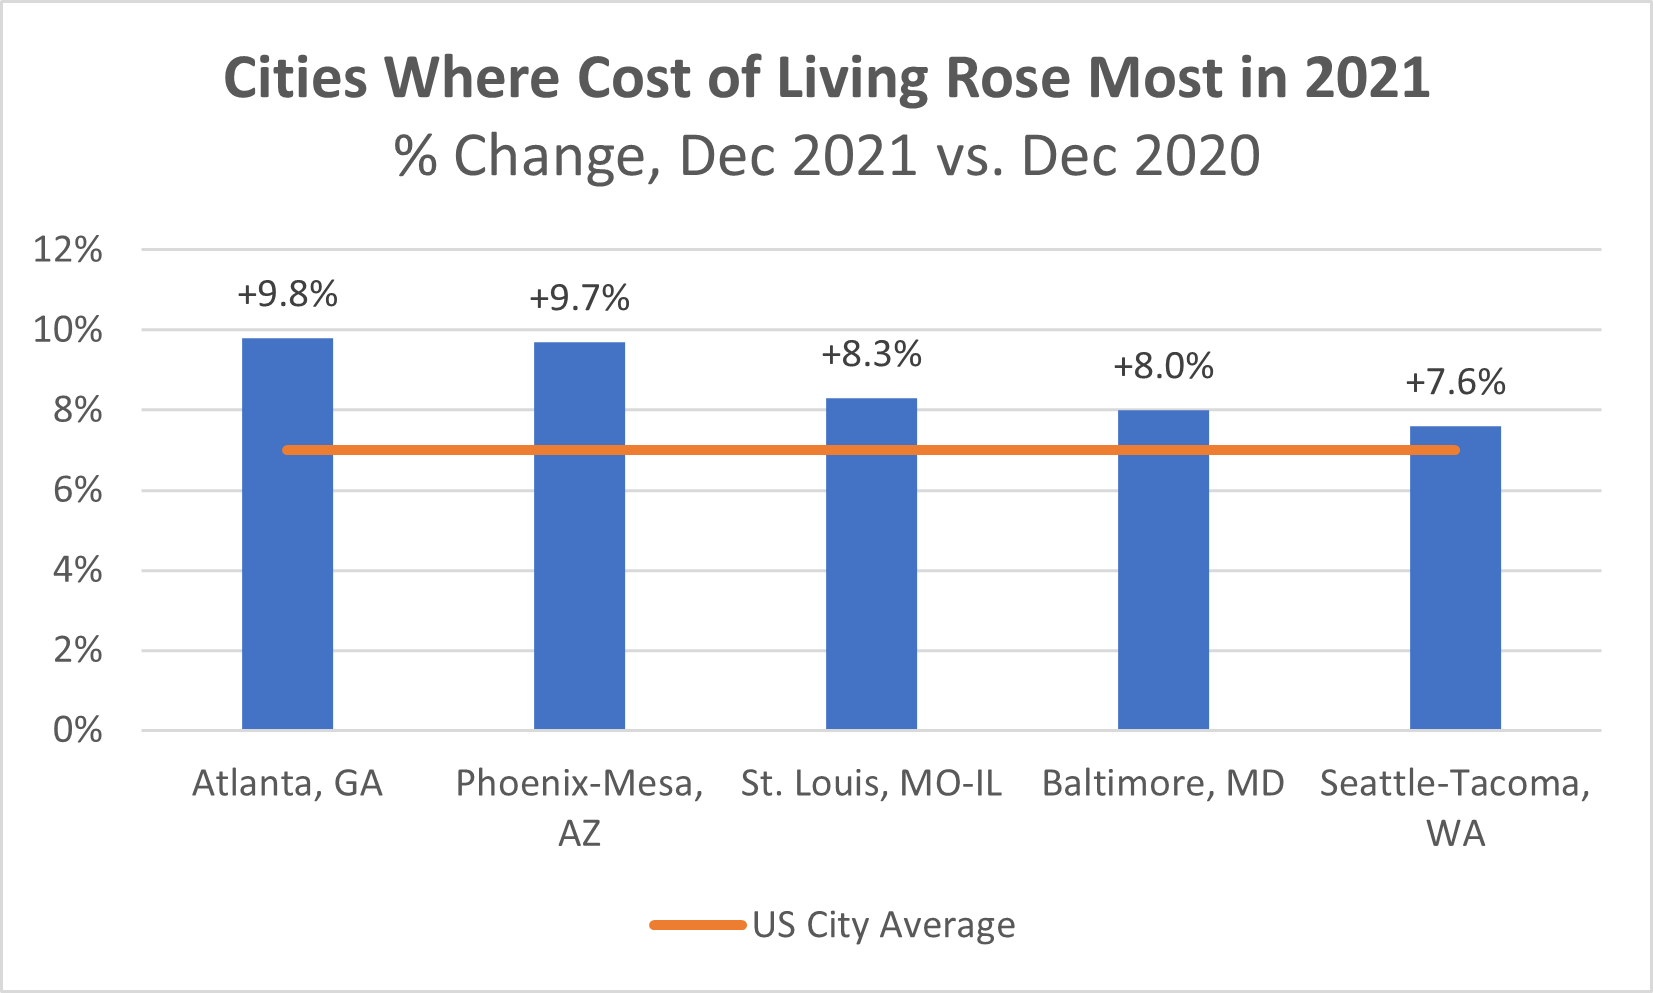
The all-item Consumer Price Index (CPI) rose 7% in the average US city in 2021, according to new data from the Bureau of Labor Statistics.
Some metros, like the Atlanta and Phoenix areas, saw starker increases in cost of living:
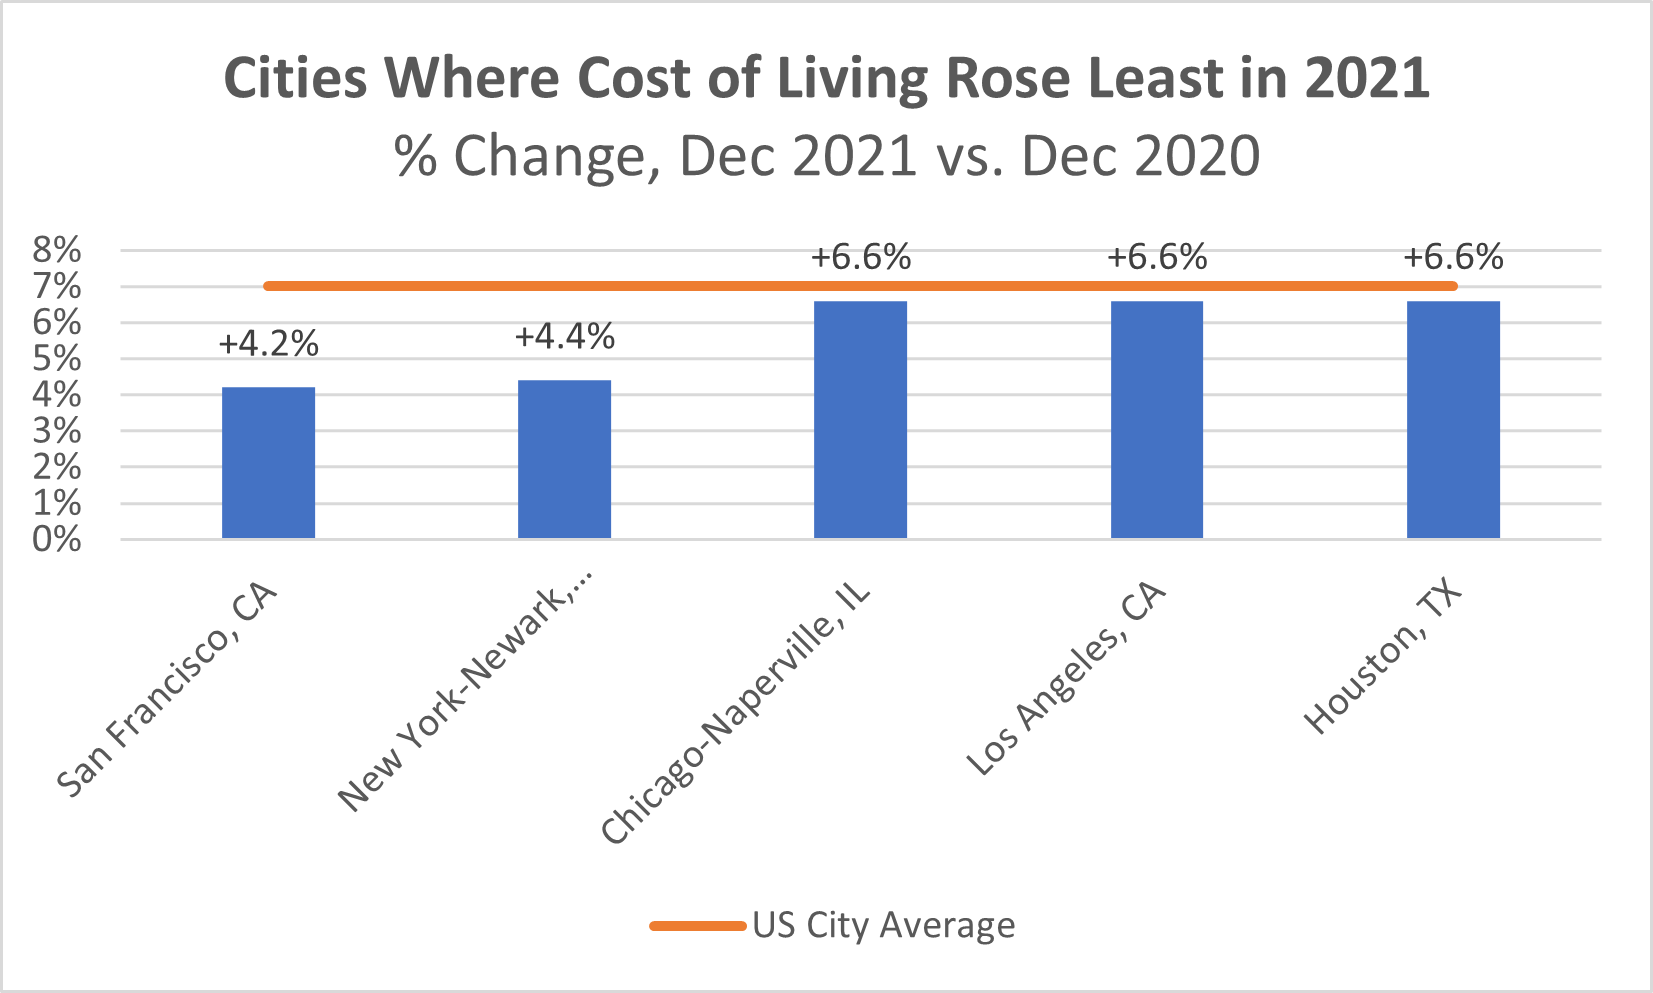
Meanwhile, San Francisco and New York experienced smaller upticks than average:
What accounts for the increase? From the BLS:
 Increases in the indexes for shelter and for used cars and trucks were the
 largest contributors to the seasonally adjusted all items increase. The food
 index also contributed, although it increased less than in recent months,
 rising 0.5 percent in December. The energy index declined in December, ending
 a long series of increases; it fell 0.4 percent as the indexes for gasoline
 and natural gas both decreased.

 The index for all items less food and energy rose 0.6 percent in December
 following a 0.5-percent increase in November. This was the sixth time in
 the last 9 months it has increased at least 0.5 percent. Along with the
 indexes for shelter and for used cars and trucks, the indexes for household
 furnishings and operations, apparel, new vehicles, and medical care all
 increased in December. As in November, the indexes for motor vehicle insurance
 and recreation were among the few to decline over the month.
Below, find a sortable table of the latest CPI data for all available metro areas. NOTE: In cities where data is reported bi-monthly, most recent month of data is used.