CivMetrics collects key employment data for the largest cities in the United States. In this post, we look at new data on unemployment rates in US metro areas. For questions about our data, or to request data, please contact [email protected]. Data is from the monthly Metropolitan Area Employment and Unemployment statistics, released by the Bureau of Labor Statistics on November 2, 2022.
The new metro-level unemployment numbers were released last week, and we’ve organized all the data for all 380+ metros in one chart at the bottom of this page. First, some highlights:
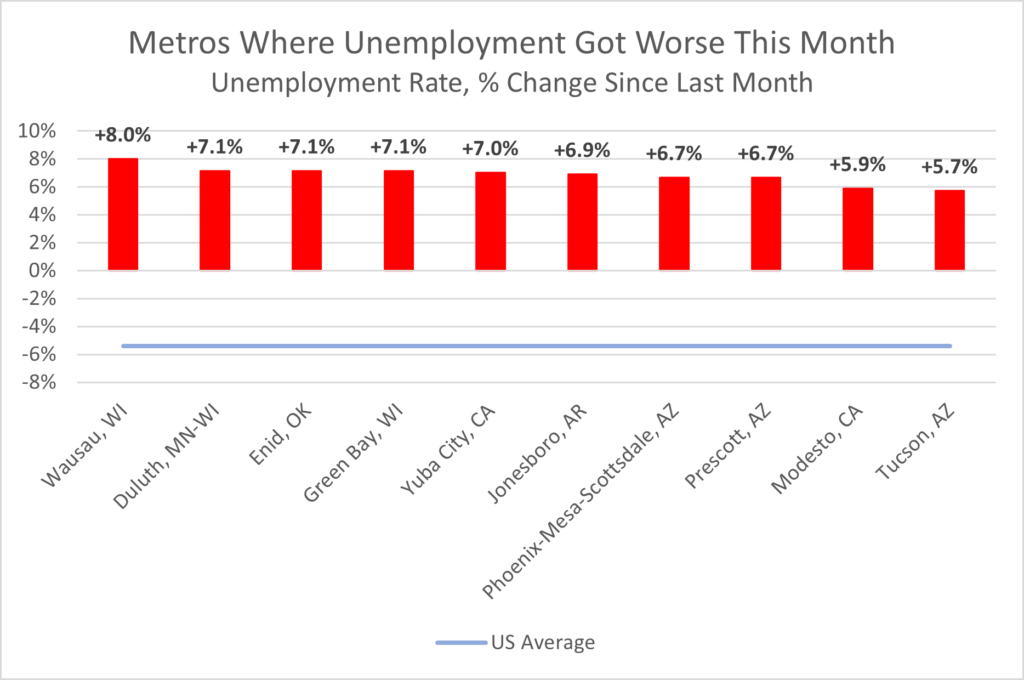
Here are the 10 metro areas that saw the biggest month-over-month increase in unemployment:

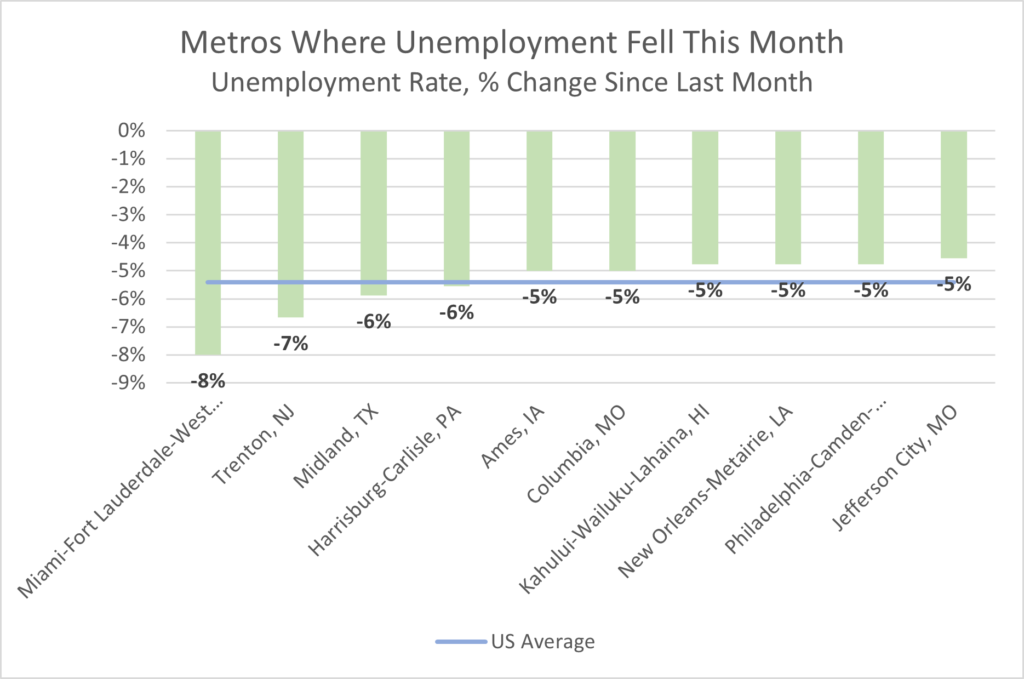
Here are the 10 metros that saw the biggest month-over-month drop in unemployment:

Finally, here are the unemployment numbers for all 380+ metro areas.


