CivMetrics collects key travel and tourism data for the largest cities in the United States. We’re posting some of our insights here. In this installment, we look at hospitality & leisure employment in every MSA. For questions about our data, or to request data, please contact [email protected]. Data is from the Bureau of Labor Statistics.
How did local tourism industries recover in 2021? In this post, we look at employment in local hospitality & leisure industries in June 2021, compared to June 2020 (the depths of the pandemic).
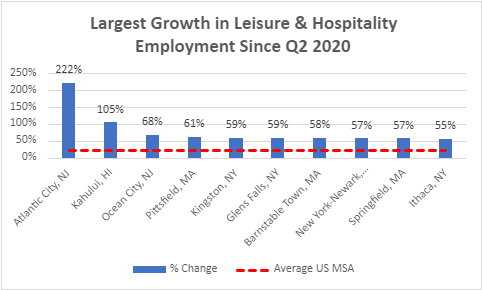
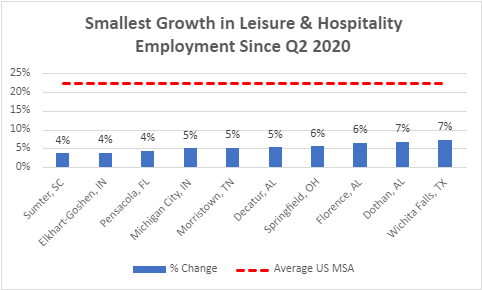
The good news: employment in hospitality & leisure grew 22% in the average metro area over this period. The bad news: Some MSAs were not as successful as others.
At the bottom of this page, find a sortable table of 380 U.S. MSAs, and how their tourism-related employment changed between June 2020 and June 2021. But first, a couple highlights:
Which MSAs saw the most growth in hospitality & leisure employment?
Some MSAs have not recovered:
Below, find a sortable table of 380 U.S. MSAs, and how their tourism-related employment changed between June 2020 and June 2021.