CivMetrics collects key travel and tourism data for the largest cities in the United States. We’re posting some of our insights here. In this installment, we look at hospitality & leisure businesses in every MSA. For questions about our data, or to request data, please contact [email protected]. Data is from the Bureau of Labor Statistics.
In the summer of 2020, with the US in the depths of the pandemic, many tourism-related businesses closed. How many had re-opened for the summer of 2021? In this post, we look at the number of hospitality & leisure establishments in every U.S. MSA.
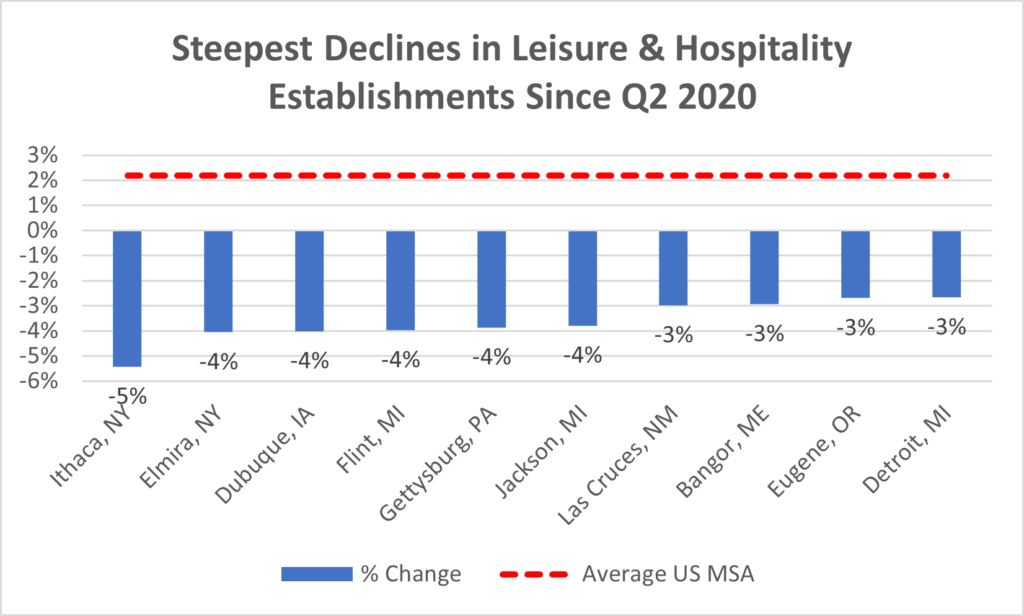
Overall, the number of establishments has been slow to recover; the average MSA saw a 2.2% growth in establishments in the summer of 2021 vs 2020.
At the bottom of this page, find a sortable table of the growth (or decline) of hospitality & leisure establishments in each MSA. But first, a couple highlights:
Of the 10 MSAs with the largest growth in establishments, four were in Georgia:
Most MSAs did not fare so well. But a few MSAs actually had fewer establishments in 2021 than they did in 2020.

Below, find a sortable table of the growth (or decline) of hospitality & leisure establishments in each MSA.


